How to trade a divergence Pattern
Divergence technique in forex trading. We will learn how to trade using the divergence strategy. This is the safest technique and rarely fails. Learn everything in this article until you understand the divergence that we will tell you about.
Indicators used
There is no need to use certain indicators because divergence is a system, not something that is tied to this or that indicator. But there is such a thing as an indicator category. The category of indicators that can be used for divergence analysis are indicators that function to find overvought and oversold levels. For example, such as stochastic, RSI, CCI, demarkers, awesome oscillators, and so on.
Definition of divergence
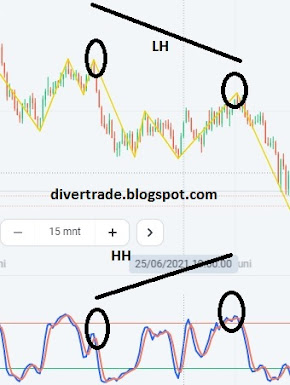
I will convey the meaning of divergence by using simple language so that it is easy to understand. Maybe we start first by knowing the relationship between the overbought oversold indicator with the swing on the main chart. For more details, look at the following image first:
I marked the swings on the main chart using numbers for easy sorting.
Starting with the number 1, on the chart a High is formed and the same as in the stochastic also a High is formed.
The number 2 is also still in line to form a Low.
Followed by the number 4 is still in line.
But at number 3 there is an imbalance, the chart makes a Lower High but the stochastic makes a Higher High, this is a type of bearish hidden divergence so after that the price goes down.
From the example above, it can be concluded that divergence is a swing imbalance / imbalance on the main chart and overbough / oversold indicators.
Types of divergence
1. Regular Divergence
Regular divergence almost often occurs at the end of a trend because it is a sign that the trend will end and will become a new trend reversal.
Example of a regular bullish divergence:
The price formed a lower low while the indicator formed a higher low then the price goes up as expected.
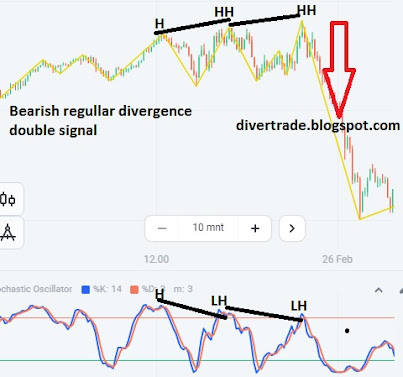
Example of a regular bearish divergence:
2. Hidden divergence
Hidden divergence will usually appear in the middle of the trend and is a signal of trend continuation, in other words the trend will continue.
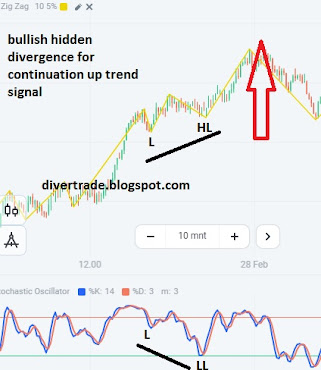
Example of a bullish hidden divergence:
When the price forms a higher low, the stochastic forms a lower low then the price goes up as expected.
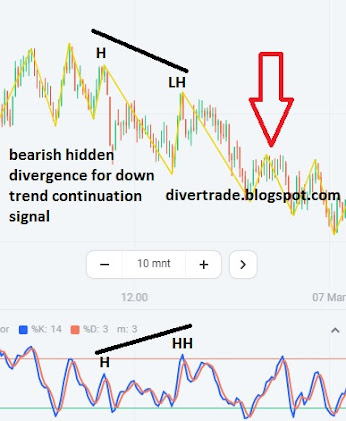
Example of a bearish hidden divergence:
When the price forming lower high but the indicator forming higher high then is confirmed as a bearish continuation signal which make the price go lower as expected.
How to enter divergence
Here's how to enter a trade using divergence.
First, pay attention to each swing on the main chart and the overbought/oversold indicators.
Easy way to find divergence:
For regular divergence, when the trend is bearish, focus on the swing low and when it is bullish, only pay attention to the swing high.
While on hidden divergence, when the trend is clear, focus on swing highs and when bullish, pay attention to swing lows.
By applying this method, when you find a swing difference between the price chart and the indicator, you can be sure it is a divergence and you can enter.
The stoploss level was on the previous swing, so you look to the left. For example, if you enter a buy, then the SL is below the previous swing low, and if the entry sells, then the SL is above the previous swing high.
The take profit level is usually at least 2 times the SL distance (1:2) that's why this divergence is very good to apply in trading because the risk reward will be very healthy.
Good luck, good luck in trading. If you have any questions or need personal guidance, please contact us on the contact form.


0 Response to "How to trade a divergence Pattern"
Post a Comment